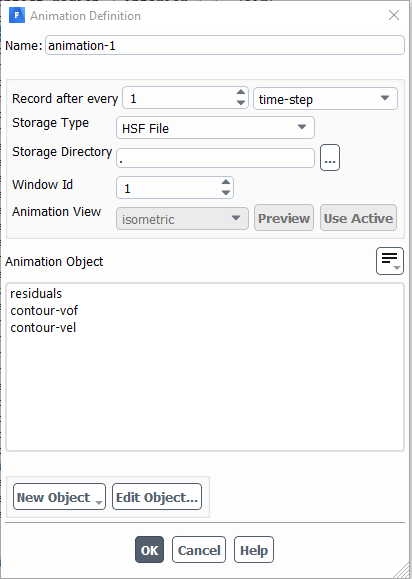
The simplest method is to use Fluent GUI when running on a local machine. All I need to do is just click on Calculation Activities -> Solution Animations and the image below tells the whole story. Just make sure to setup the animation objects correctly:

The second method is something that I usually forget. It is rather rare to run a simulation on the local machine and I often end up submitting my simulation jobs on a cluster. Since there is usually not a graphical interface on the cluster, this should be done with TUI commands through a journal file by saving a sequence of solution snapshots. In brief, the journal file should carry out three steps after reading the case and data files:
- Configure images output
- Create contours
- Setup
execute-commands
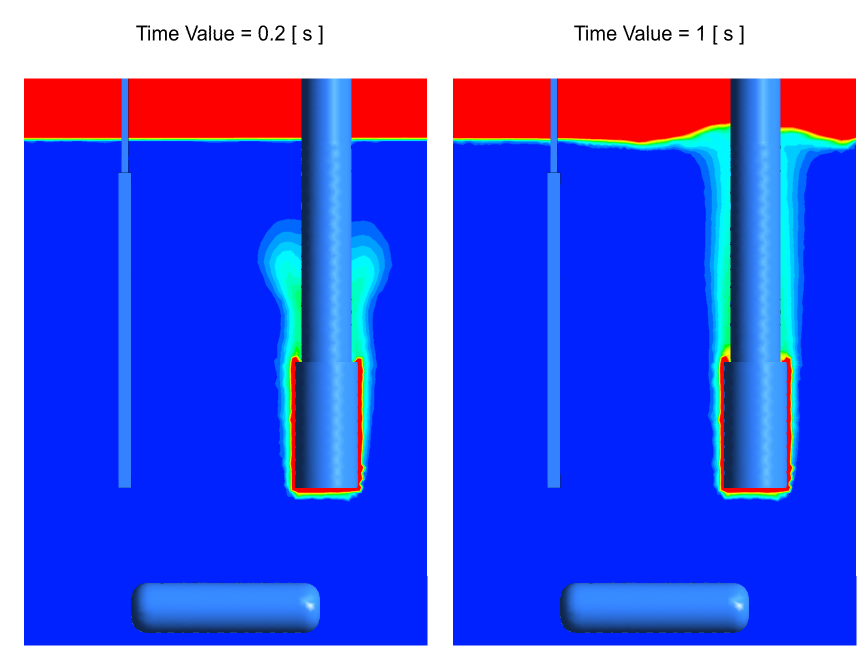
Let’s walk through the tree steps by creating an animation of how gas bubbles disperse into the liquid phase in a bioreactor.

1. Configure images output
As the sequence of images are saved for certain number of time-steps or iterations, it is important to make sure the output images are consistence. This is done via the following commands in a journal file:
/display/set/contours/filled-contours yes
/display/set/picture/driver png
/display/set/picture/landscape yes
/display/set/picture/x-resolution 1440
/display/set/picture/y-resolution 1000
/display/set/picture/color-mode color
/display/set/windows/text/date yes
/display/set/windows/text/visible yes
/display/set/windows/text/border no
/display/set/windows/main/border no
/display/set/colors/graphics-color-theme black
/display/set/line-weight 2
The commands are rather self-explanatory, but for clarity, they setup the file
extension to png, fix the resolutions, make sure the time is visible and set
the color theme for the images.
2. Create contours
After setting up the images, the second step is to create the contour plots. This is perhaps the straightforward phase that includes selecting the surfaces on which the flow variables are to be displayed and defining details of the contour plots. Here is an example for generating contours of gas volume fraction:
display/set/contours/surfaces
inlet_diffusion
plane-normy-5mm
plane-xy
capsule
wall_electrode
wall_pin-air_zone
wall_pin-part-solid
wall_probe
wall_tube-air_zone
wall_tube-part-solid

/display/set/contours/n-contour 25
/display/set/contours/auto-range no
/display/set/contours/clip-to-range no
/display/views/restore-view iso
/display/views/auto-scale
/display/contour air vof 0 0.15
A neat trick is to save the contour plots at t = 0 s, so the movie starts at
time zero of the simulation.
/display/save-picture airvof_%t.png
3. Setup execute-commands
The last step is to use execute-commands feature of Fluent to save snapshots
during the simulation for different time instances. I can save pictures at
different time-steps or iterations and always remember to enable the execute-commands!
/solve/execute-commands/add-edit command-3 30 "time-step" "/display/contour air vof 0 0.15"
/solve/execute-commands/enable command-3
/solve/execute-commands/add-edit command-4 30 "time-step" "/display/save-picture airvof_%t.png"
/solve/execute-commands/enable command-4
And that’s pretty much it.
